


Marimekko Chart Maker Effortlessly Creates Stunning Visual Data Charts
Ellen Smith — March 3, 2025 — Lifestyle
References: mekkocharts
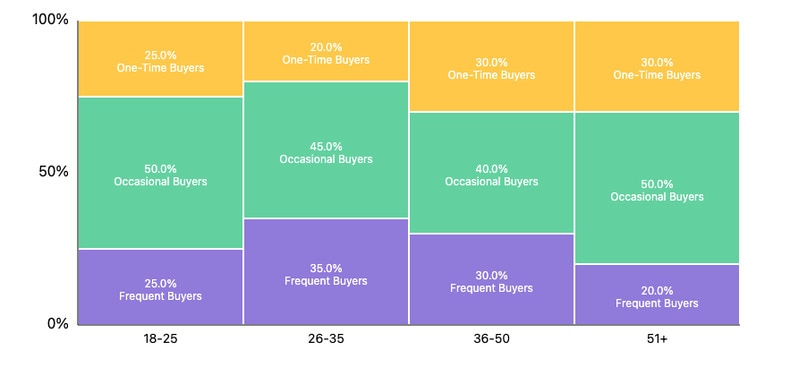
The Marimekko Chart Maker is an intuitive online tool that allows users to quickly create visually appealing Marimekko charts. This type of chart is ideal for visualizing proportional data across multiple categories, offering businesses and analysts a clear and colorful representation of their data.
The platform's user-friendly interface simplifies the process, enabling individuals to generate these charts with minimal effort, saving both time and resources. The ability to create customized, aesthetically pleasing charts is especially valuable for presentations and reports, enhancing the visual appeal of complex data. With Marimekko Chart Maker, businesses can communicate trends and insights in a more engaging and effective manner, ensuring that their data-driven decisions are supported by clear, easy-to-understand visual representations.
Image Credit: Marimekko Chart Maker
Trend Themes
1. User-friendly Data Visualization - Advanced intuitive tools like the Marimekko Chart Maker make it easy to visualize complex data without extensive training.
2. Customization in Analytics Tools - The growing demand for customized chart options highlights the trend towards more tailored data presentation solutions.
3. Enhanced Data Storytelling - Visual tools that enhance storytelling through data improve the clarity and effectiveness of business communication.
Industry Implications
1. Business Analytics Software - The industry is evolving with tools that offer seamless and beautiful data visualization solutions to streamline decision-making processes.
2. Presentation Software - Innovative chart-making platforms are transforming how data is presented and interpreted in professional settings.
3. Data Science and Visualization - Emerging visualization tools simplify the interpretation of complex datasets, fostering better insights and data-driven strategies.
4.2
Score
Popularity
Activity
Freshness