These Silly Charts From The Bold Italic Tell the Truth About the Oscars
Alyson Wyers — February 20, 2015 — Pop Culture
References: thebolditalic & designtaxi
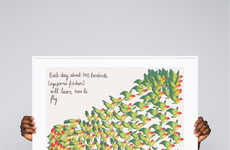
These funny charts reveal the honest truth about the Oscars. From The Bold Italic, the illustrated graphs were written by Cecilia Rabess and drawn by Jessica Saia.
The series of charts look at topics like reactions when the camera pans to your face after you've just lost, outliers, how to increase your odds for an Oscar nod, Venn Diagrams detailing Academy Award attendance, the celebrity cycle of award-season emotions and delusions of film-fanatic grandeur. Two particularly hilarious charts examining the truth about the Oscars are 'What it Takes to Get the Academy's Attention: A Selection of Oscar Nominees Over the Years' and 'Whom Should I Thank? A Flowchart.' The former looks at the cross-sections between funny accents, war and being Meryl Streep, where as the latter heavily emphasizes expressing gratitude for Oprah.
The series of charts look at topics like reactions when the camera pans to your face after you've just lost, outliers, how to increase your odds for an Oscar nod, Venn Diagrams detailing Academy Award attendance, the celebrity cycle of award-season emotions and delusions of film-fanatic grandeur. Two particularly hilarious charts examining the truth about the Oscars are 'What it Takes to Get the Academy's Attention: A Selection of Oscar Nominees Over the Years' and 'Whom Should I Thank? A Flowchart.' The former looks at the cross-sections between funny accents, war and being Meryl Streep, where as the latter heavily emphasizes expressing gratitude for Oprah.
Trend Themes
1. Honest Humor - The trend of infusing honesty and humor in unconventional ways to communicate broader, institutional messages such as the Oscars creates opportunities for humor-centered professionals to promote their work.
2. Authentic Audience Engagement - The trend of leveraging humor to draw attention to topics that are typically dry and informational like the Oscars creates opportunities for companies to engage audiences on a more human level.
3. Visual Storytelling - The trend of using illustrated charts, diagrams, and graphs to tell stories in a funny and engaging way, such as the ones featured in this article, creates opportunities for professionals specializing in graphics design to find new ways to market their work.
Industry Implications
1. Advertising - The advertising industry can adopt the trend of using humor to communicate brand messages instead of typical 'slick' productions.
2. Entertainment - The entertainment industry can leverage the trend of humor in discussing their own process to draw viewers into their films, music, and shows.
3. Media - The media industry can utilize the trend of visual storytelling to simplify complex topics and encourage user engagement with their content.
0.4
Score
Popularity
Activity
Freshness


