'A Matter of Life and Death' Showcases How Long Fruit Lasts
Tia Clarke — April 30, 2013 — Art & Design
References: chloesilver & visual.ly
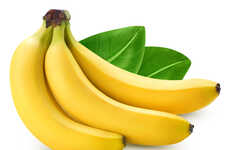
If you've ever wondered how long fruit lasts, then this easily digestible flowchart will make sure your bananas never turn to mush again. The chart showcases the short life span of an apple, strawberry, orange and a banana, once they have been sliced into. Apples fare the best in this survey, taking a full week to decompose, whilst strawberries will only last three days before becoming totally inedible.
The chart also provides us with some handy nutrition tips. For example, did you know that oranges contain such high amounts of acid that they can be detrimental to tooth enamel over long periods of time?
This handy chart will provide you with information in bite-size chunks that will help you out the next time you're wondering why your fruit is no longer edible.
Trend Themes
1. Shortened Shelf Life - Opportunity for innovation in food preservation methods to extend the shelf life of fruits and reduce food waste.
2. Health-conscious Consumption - Potential for developing new products and services that cater to consumers' desire for nutrition information and healthier food choices.
3. Visual Information Design - Emerging trend of using infographics and flowcharts to present complex data in an easily digestible format, creating opportunities for creative visual communication solutions.
Industry Implications
1. Food Preservation - Disruptive innovation opportunities in improving current food preservation techniques and developing new technologies for extended fruit shelf life.
2. Nutrition and Wellness - Innovative solutions in providing consumers with easy access to detailed nutrition information and promoting healthier food choices.
3. Graphic Design and Data Visualization - Opportunities for creative professionals in designing visually engaging infographics and flowcharts for effective data communication.
6.1
Score
Popularity
Activity
Freshness

