


Zipcode Heat Map Visualizes Data Density for Sales, Deliveries & More
Ellen Smith — January 30, 2025 — Lifestyle
References: zipcodeheatmap
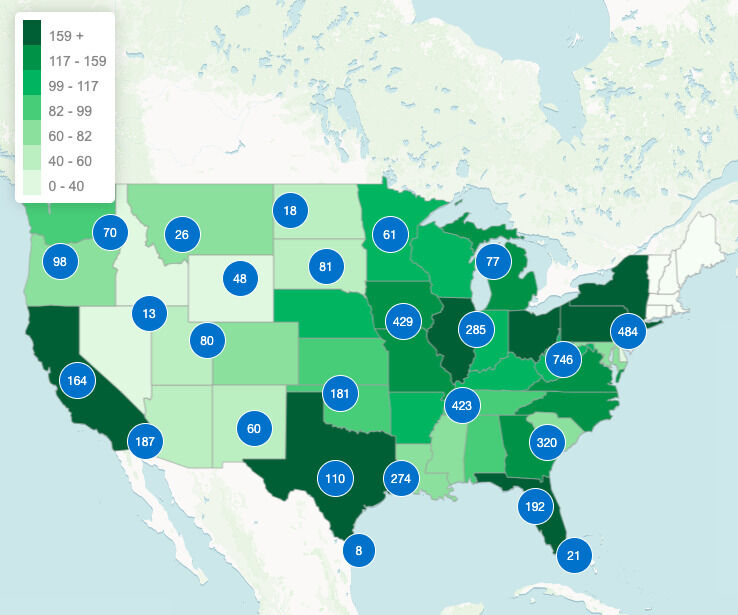
Zipcode Heat Map is a powerful tool for visualizing data across US states and counties. By uploading spreadsheets containing zip codes, users can generate detailed thematic heat maps that represent data density in various sectors, including sales, deliveries, or real estate.
This tool is especially valuable for businesses looking to analyze regional trends or identify areas of opportunity. With its intuitive interface, Zipcode Heat Map simplifies the process of creating customized maps that help businesses make data-driven decisions. The visual representation of data allows users to easily spot patterns and optimize strategies accordingly. Whether you’re tracking sales performance or mapping delivery areas, Zipcode Heat Map provides an efficient, accessible way to turn raw data into actionable insights for business growth.
Image Credit: Zipcode Heat Map
Trend Themes
1. Data-driven Regional Analysis - Harnessing visual tools for regional data allows businesses to identify patterns and optimize strategies based on geographic insights.
2. Visual Data Simplification - Converting complex datasets into visual heat maps enhances comprehension and aids faster decision-making for business professionals.
3. Customized Geographic Insights - Custom maps that highlight specific data points offer businesses the ability to tailor insights precisely to their needs, revealing unique opportunities.
Industry Implications
1. Retail Sales - Retailers can utilize zipcode-based visualizations to uncover trends and strategize inventory placement and marketing efforts.
2. Logistics and Deliveries - Logistics companies stand to revolutionize route planning and resource allocation through detailed geographic data density visualizations.
3. Real Estate Analysis - Real estate firms gain a competitive edge by interpreting localized data patterns to assess market potential and strategize investments.
5.3
Score
Popularity
Activity
Freshness