This Educational Map Shows US Carbon Emissions By Individual Zip Codes
Alyson Wyers — January 16, 2014 — Eco
References: coolclimate.berkeley.edu & fastcoexist
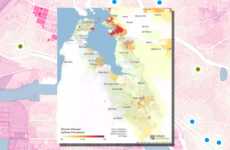
This colorful and interactive map put together by the University of California, Berkeley depicts US carbon emissions by zip code. This offers a very detailed look at the carbon footprints left by different, and specific, parts of the country.
This allows one to examine how much different places contribute to global warming and climate change. To compile the carbon footprint maps, the school used estimates for all 31,000 American zip codes and how much they consume in a year, including energy, travel, goods and services.
Shockingly, it can be found by looking at these US carbon emissions stats that suburbs produce 50% of household greenhouse gas emissions. Meanwhile, those living in the inner cities have a smaller carbon footprint due to smaller living quarters and easy access to public transit.
Trend Themes
1. Detailed Carbon Footprint Mapping - The trend of creating interactive maps that provide detailed information about carbon emissions by zip code can disrupt the environmental monitoring industry.
2. Understanding Local Contribution to Climate Change - The trend of using zip code-level data to analyze carbon footprints can disrupt urban planning and policy-making by helping identify areas that need targeted sustainability initiatives.
3. Suburban Vs Urban Carbon Footprints - The trend of comparing carbon emissions between suburbs and inner cities highlights the need for innovative solutions in transportation, housing, and energy sectors to mitigate the environmental impact of suburban living.
Industry Implications
1. Environmental Monitoring - The environmental monitoring industry can leverage interactive carbon footprint mapping to provide more accurate and localized data to businesses and policymakers.
2. Urban Planning and Policy - The use of zip code-level carbon footprint data can help urban planners and policy-makers develop more sustainable and targeted initiatives at a local level.
3. Transportation, Housing, and Energy - The transportation, housing, and energy industries can explore disruptive innovation opportunities to reduce carbon emissions in suburbs and develop more sustainable living options.
5.2
Score
Popularity
Activity
Freshness


