Taxi Stockholm's Map Points Out the Hottest Spots in the City
Laura McQuarrie — July 31, 2014 — Autos
References: taxitrails.se & adverblog
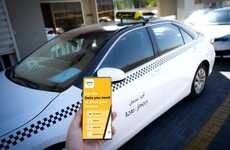
Taxi Stockholm is the biggest taxi company in Stockholm, making over 8 million trips per year. To help users get a better sense of the city, the King agency helped to develop the 'Taxi Stockholm 150,000' featuring a map that nearly organizes data collected from GPS systems.
On the map, viewers are able to filter choices like trips by month, year, weekdays, weeknights and time of day. On top of this, choosing to look only at "posh" or "hip" routes will only show travel in certain areas of Stockholm. The coloring on the map is presented in bright orange and yellow tones, making it like a literal representation of where the hot spots in the city are, because they're so heavily traveled.
On the map, viewers are able to filter choices like trips by month, year, weekdays, weeknights and time of day. On top of this, choosing to look only at "posh" or "hip" routes will only show travel in certain areas of Stockholm. The coloring on the map is presented in bright orange and yellow tones, making it like a literal representation of where the hot spots in the city are, because they're so heavily traveled.
Trend Themes
1. Personalized City Mapping - Creating maps that allow users to filter and customize data collected from GPS systems to provide personalized insights about a city's hotspots.
2. Data Visualization in Transportation - Using bright colors and visual cues on maps to represent heavily traveled areas and help users navigate a city more effectively.
3. Intelligent Filtering for Urban Exploration - Developing tools that enable users to filter travel options based on specific criteria such as month, year, weekdays, weeknights, time of day, and the type of experience they are seeking.
Industry Implications
1. Transportation - Creating innovative mapping solutions for taxi companies, ride-sharing platforms, and other transportation companies to enhance the user experience and provide valuable insights.
2. Tourism and Travel - Using data visualization techniques to help tourists and travelers explore and navigate cities more efficiently, highlighting popular attractions and hotspots.
3. Location-based Services - Developing filtering tools and personalized mapping features for location-based service providers to offer customized recommendations and improved user experiences.
2.5
Score
Popularity
Activity
Freshness


