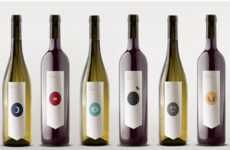
Sean Seidell's Colorful Chart Classifies 20 Tasty White Wines
— June 14, 2013 — Lifestyle
References: seanseidell & fastcodesign
A new infographic by graphic designer Sean Seidell provides a colorful and fun classification of 20 tasty white wines.
The infographic is separated into five different taste categories: very dry, dry, off dry, semi-sweet and sweet. Clustered around these different qualities are types of white wine, from the dry bordeaux to the sweet muscat.
For people who aren't very familiar with different varieties of wine, this infographic is the perfect way to gain an understanding of different wine varieties. If wine drinkers know that they prefer a certain taste -- dryness, for instance -- they can also use this infographic to see other types of wine within the same category that they might not have tried before.
With Seidell's clever and useful white wine infographic, drinking wine will never be a dull or repetitive affair ever again.
Trend Themes
1. Wine Infographics - Creating interactive and visually appealing infographics to educate consumers about different types of wines.
2. Wine Classification - Developing innovative systems and algorithms to classify wines based on taste profiles and characteristics.
3. Personalized Wine Recommendations - Leveraging technology to provide personalized wine recommendations based on individual taste preferences and past consumption data.
Industry Implications
1. Graphic Design - Opportunity to create stunning and engaging wine infographics to visually represent wine categories and characteristics.
2. Wine Production - Implementing advanced classification systems and algorithms to enhance the categorization of wines and assist consumers in making informed choices.
3. Wine Retail and E-commerce - Utilizing data-driven algorithms and personalized recommendation engines to offer tailored wine options to customers, boosting customer satisfaction and loyalty.
1.6
Score
Popularity
Activity
Freshness


