This Infographic Explores Various Kinds of Info Charts
Andrew Sztein — April 8, 2013 — Art & Design
References: econsultancy & bitrebels
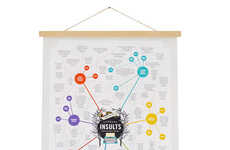
We've officially reached the meta level of infographics with this infographic infographic from Neo Mammalian Studios and Econsultancy.
It seems like there's an infographic out there about every topic presented in a variety of different ways. Where this infographic infographic comes into useful play is that if you're looking to convey information in infographic form, this is a very useful guide for figuring out which direction to go in. The infographic goes through the pros and cons of various types of charts including flow charts, visualized articles, timelines, useful bait, versus infographics, number porn, photo infographics and data visualizations. It's all very useful information for those looking to get a whole bunch of information across in a visual format.
I think this article may set a record for the biggest concentration of the word 'infographic' ever.
Trend Themes
1. Interactive Infographic Design - There is an opportunity to innovate in the interactive design of infographics, making them more engaging and user-friendly.
2. Virtual Infographic Creation - A trend towards creating infographics in virtual reality presents an opportunity for innovation with 3D data visualization.
3. AI-generated Infographics - Innovative AI-powered tools can offer custom infographic designs and data analysis, enabling efficient and scalable infographic creation.
Industry Implications
1. Graphic Design Industry - The graphic design industry can leverage these trends to revamp their services and offer interactive and customized infographic designs to clients.
2. Marketing Industry - The marketing industry can harness the power of innovative infographics to communicate brand messaging and engage audiences in a more impactful way.
3. Education Industry - The education industry can leverage AI-powered infographic tools to create visual aids for classrooms, offering students a more stimulating and interactive learning experience.
1.6
Score
Popularity
Activity
Freshness

