Vizzy Turns Data Into Graphs, Maps, Charts, and More
Ellen Smith — February 16, 2024 — Tech
References: vizzy.rbren.io
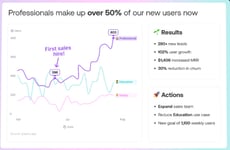
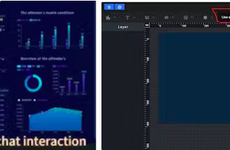
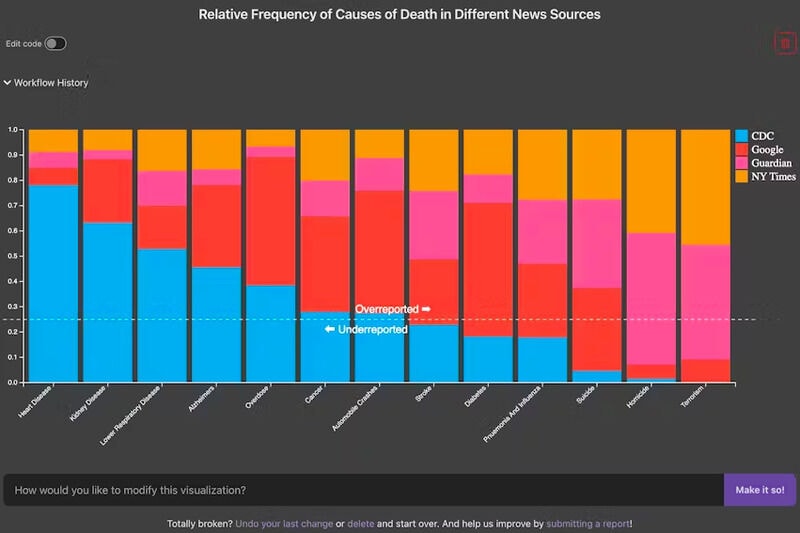
Presenting data in a meaningful and understandable way can be a challenge, especially for those unfamiliar with numbers and statistics – that's where Vizzy comes in, offering AI data interpretation. Powered by ChatGPT, Vizzy is a useful tool that transforms raw data into visually engaging graphics, making it easier to interpret and comprehend.
With Vizzy, users can input any form of data and watch as it's transformed into visually appealing charts, graphs, maps, or any other type of graphic necessary. This capability not only simplifies the process of presenting data but also helps people connect with information that might otherwise be overwhelming or confusing.
Whether for work presentations, social media posts, or any other situation where data visualization is needed, Vizzy empowers users to effectively convey information and engage their audience with clear, compelling visuals.
Image Credit: Vizzy
Trend Themes
1. AI Data Interpretation - Vizzy utilizes AI data interpretation to transform raw data into visually engaging graphics.
2. Data Visualization - Vizzy simplifies the process of presenting data by transforming it into visually appealing charts, graphs, and maps.
3. Engaging Visuals - Vizzy empowers users to convey information and engage their audience with clear, compelling visuals.
Industry Implications
1. Business Intelligence - Vizzy's AI data interpretation can be applied in the business intelligence industry to visually represent complex data for better decision-making.
2. Marketing and Advertising - The data visualization capabilities of Vizzy can help marketers and advertisers create visually compelling campaigns.
3. Education and Training - Vizzy's ability to transform data into engaging visuals can be leveraged in the education and training industry to enhance learning experiences.
2.4
Score
Popularity
Activity
Freshness

