Humboldt State University's Hate Heat Map Shows Where American Bigotry Is
Alexander Lam — May 15, 2013 — Tech
References: users.humboldt.edu & fastcocreate
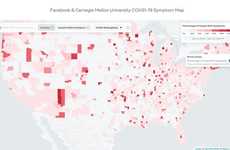
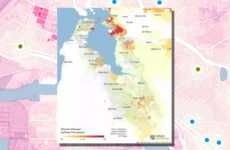
Researchers at Humboldt State University created a heat map of the United States showing where the largest volume of bigoted tweets were. The map tracks homophobic, racist and disability slurs used in a negative context.
The map allows you to sort through and choose categories of slurs and specific slurs used. Each subcategory of slur has its own unique heat map. In addition, every specific term has an unique map as well.
Tweets from June 2012 to April 2013 were used to compile this map. An algorithm used sentiment analysis to identify possible negative tweets. These tweets were then reviewed by humans using a rubric to identify whether they were meant to be negative. The resulting collection of tweets identified as negative by humans was used to generate the hate heat map.
Trend Themes
1. Social Media Hate Speech Monitoring - Opportunity to develop AI-powered tools that can monitor social media platforms for hate speech based on sentiments and keywords.
2. Data Visualization for Social Issues - Opportunity for data visualization tools that can help in identifying and addressing social issues, particularly those related to hate speech and bigotry.
3. Online Community Policing - Opportunity to develop tools and platforms that empower online communities to self-police and report incidents of hate speech and bigotry.
Industry Implications
1. Social Media - Tools and AI algorithms for identifying and addressing hate speech present significant opportunities for the social media industry.
2. Data Analytics - Data visualization and analysis of hateful speech could lead to new business opportunities in data analytics and social issue monitoring.
3. Community Engagement - Online community policing initiatives have the potential to revolutionize how communities engage with each other on social media and other online platforms.
4.1
Score
Popularity
Activity
Freshness


