Discover the Reasons People are Drawn to Data Visualizations
Gil Cohen — September 3, 2013 — Pop Culture
References: graphs.net & visual.ly
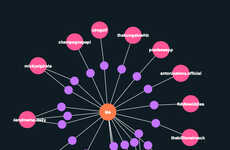
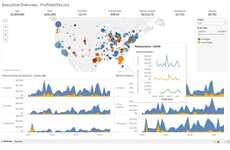
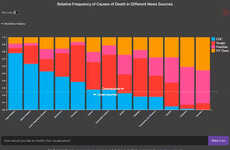
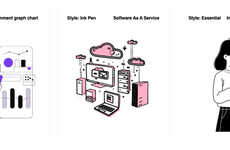
More and more, people have begun gravitating towards infographic formats of data visualizations in order to consume their information.
This meta-style chart created by Graphs.net explores the reasons why people are so drawn to these types of charts and how businesses can utilize this information to then draw in a greater range of consumers. Statistics show that there has been a dramatic increase in infographic popularity, going up by 800% in the past couple of years alone.
With a universal predisposition towards visual learning, especially when it comes to the youth of today's tech-immersed world, data visualizations such as infographics are the best way to capture the attention of most readers and keep them interested in the knowledge and facts you want them to understand.
Trend Themes
1. Rise of Infographic Formats - The increasing popularity of infographics as a data visualization format presents an opportunity for businesses to effectively communicate information.
2. Visual Learning Preference - The universal predisposition towards visual learning creates an opportunity for businesses to engage and educate consumers through data visualizations.
3. Youth Engagement with Infographics - The youth's preference for tech-immersed, visually-driven content makes infographics an effective tool to capture their attention and deliver information.
Industry Implications
1. Marketing and Advertising - The rise of infographics offers marketing and advertising professionals an innovative way to present data and engage target audiences effectively.
2. Education - The preference for visual learning creates an opportunity for educators to utilize infographics as a tool to enhance student understanding and engagement.
3. Data Analytics - The increasing popularity of infographics highlights the need for data analytics professionals to develop visually appealing and informative data visualizations.
6.1
Score
Popularity
Activity
Freshness

