The Numerics App Provides a Customized Business Analytics Dashboard
Alyson Wyers — July 29, 2014 — Tech
References: cynapse & springwise
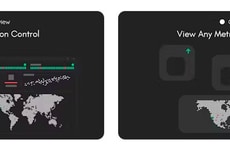
Having analytics and numerical data to back up the services you offer is key in providing or proving value, which is why a well-organized and easy to use business analytics dashboard is in high demand. Numerics is an app for smartphones and tablets that does just that. The simplified and customized business analytics make it easier for companies to measure their effectiveness using their mobile devices.
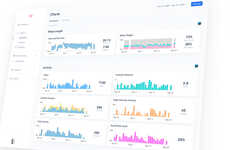
Based out of India, Cynapse developed the visually appealing app, which uses infographic-like images to help business keep track of their numbers. Using widgets, one can customize the look of the business analytics dashboard to display the most relevant data in a range of different formats. From social media engagement to sales statistics, Numerics app can pull from a variety of platforms as well.
Based out of India, Cynapse developed the visually appealing app, which uses infographic-like images to help business keep track of their numbers. Using widgets, one can customize the look of the business analytics dashboard to display the most relevant data in a range of different formats. From social media engagement to sales statistics, Numerics app can pull from a variety of platforms as well.
Trend Themes
1. Customized Business Analytics - The trend of customized business analytics dashboards allows companies to measure their effectiveness and make data-driven decisions.
2. Mobile Business Analytics - The trend of mobile business analytics apps provides companies with the convenience of accessing and analyzing data on the go.
3. Infographic-like Data Visualization - The trend of using infographic-like images in business analytics dashboards enhances data visualization and improves data understanding.
Industry Implications
1. Mobile App Development - The mobile app development industry can capitalize on the trend of mobile business analytics by creating innovative and user-friendly analytics apps.
2. Data Analytics - The data analytics industry can leverage the trend of customized business analytics dashboards by providing solutions that allow businesses to interpret and analyze their data effectively.
3. Graphic Design - The graphic design industry can seize the trend of infographic-like data visualization by offering creative and visually appealing designs for business analytics dashboards.
4.5
Score
Popularity
Activity
Freshness


