Graphy Creates Pro Graphs That Simplify Data and Drive Decision-Making
Ellen Smith — February 13, 2025 — Business
References: graphy.app
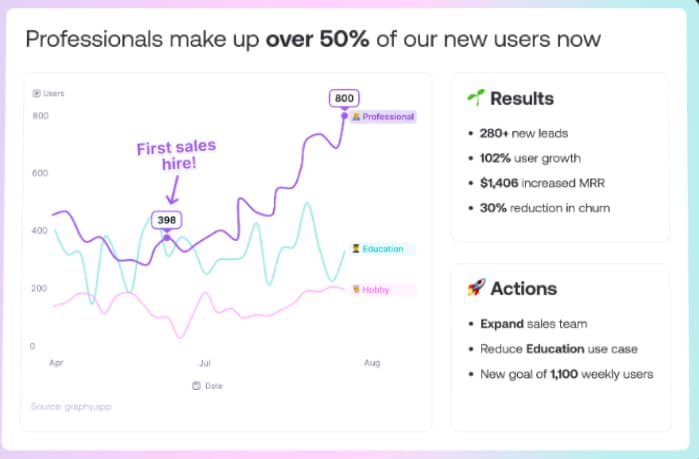
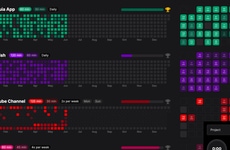
Graphy is a data visualization tool designed to help users turn complex data into actionable stories. Its user-friendly interface makes it easy for anyone, regardless of technical skill, to create professional-level graphs that communicate insights clearly and persuasively.
Graphy focuses on data storytelling, empowering users to present information in a way that resonates with their audience and drives decisions. Whether you're a marketer, business analyst, or educator, the tool offers customizable templates, advanced visualization options, and seamless integration with various data sources. By simplifying how data is shared and understood, Graphy bridges the gap between raw data and impactful communication. The result is visually engaging presentations that transform data into meaningful narratives, helping businesses make data-driven decisions with confidence.
Image Credit: Graphy
Trend Themes
1. User-friendly Data Visualization - Emerging tools like Graphy focus on simplifying data visualization, allowing users without technical expertise to produce professional-grade graphs effortlessly.
2. Data-driven Decision-making - Data storytelling tools are enhancing the way information is communicated, ensuring that insights are easily digestible and significantly influencing business decision-making.
3. Customizable Visualization Templates - The rise of customizable templates in data visualization software enables tailored presentations, making it easier to cater content to specific audiences and contexts.
Industry Implications
1. Business Analytics - Tools like Graphy are revolutionizing the business analytics industry by providing accessible, high-quality data storytelling options that assist in strategic decision-making.
2. Marketing and Advertising - Data storytelling tools have significant potential to impact marketing and advertising, as they allow professionals to present data insightfully and effectively align strategies with audience interests.
3. Education Technology - Graphy's user-oriented design opens new avenues in the education technology sector, enabling educators to convey complex data in clear, engaging ways to enhance learning outcomes.
8.3
Score
Popularity
Activity
Freshness

