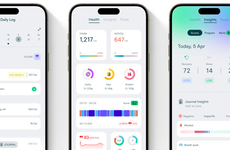
Mylens.ai Creates Insightful Visuals from Questions or Data
Ellen Smith — November 26, 2024 — Tech
References: mylens.ai
MyLens.ai is an AI-powered tool designed to transform complex information into clear and insightful visuals. The platform allows users to ask questions or upload data, which it then processes to generate graphics that make the information easier to understand.
By focusing on accessibility and simplicity, MyLens.ai aims to support learning, data analysis, and communication across a variety of fields. The tool caters to educators, business professionals, and anyone seeking to visualize insights effectively, whether for presentations, decision-making, or personal learning. Its one-click functionality eliminates the need for manual data interpretation, offering an efficient solution for presenting detailed insights in a straightforward manner. With its emphasis on creating user-friendly visuals, MyLens.ai bridges the gap between raw information and actionable understanding.
Image Credit: MyLens.ai
Trend Themes
1. AI-driven Data Visualization - Utilizing artificial intelligence to instantly convert raw data into understandable visuals simplifies complex information processing.
2. Automated Insight Generation - Automated tools capable of producing actionable insights from vast data sets enhance decision-making efficiency.
3. User-centric Design in Visual Tools - Focused on ease of use, user-centric design in visualization tools democratizes data interpretation for non-experts.
Industry Implications
1. Education Technology - EdTech platforms integrating AI-driven visualization tools support enhanced learning through clearer data presentation.
2. Business Analytics - Business analytics firms leveraging automated insight generation can offer more precise and efficient data-driven strategies.
3. Data Communication Solutions - Industry players providing data communication solutions benefit from incorporating tools that simplify data visualization for broader accessibility.
4.5
Score
Popularity
Activity
Freshness


