The ‘KISSmetrics’ Chart Explains When It’s Optima
Sarah Nazim — July 18, 2012 — Social Media
References: facebook & blog.kissmetrics
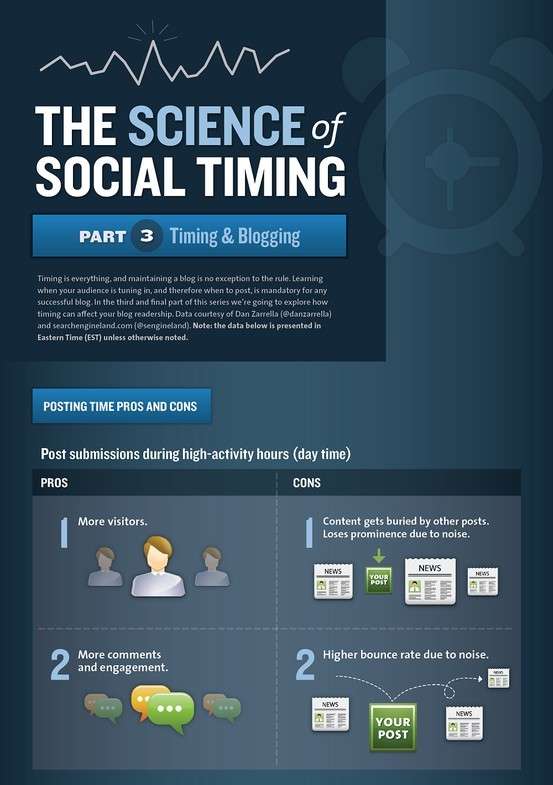
The ‘KISSmetrics’ Infographic explains when it is optimal to publish blog posts. With the huge amounts of information-sharing that takes place on sites like Facebook and Twitter, how can one ensure that their material gets the most attention?
High-activity hours are during the day, while low-activity hours are at night. The pros to high-activity hours is that it drives more visitors and comments; however, it can be easily lost in the mix of other posts, which also leads readers to higher bounce rates. The upside to posting during low-activity hours is that you get more visibility despite lower engagement and less visitors.
According to this chart, users tend to read blog posts in the morning, and Mondays usually generate the most traffic. This is vital information for bloggers and companies that are utilizing blog platforms to promote their products and services.
Trend Themes
1. Optimal Blog Post Timing - Utilize the 'KISSmetrics' Chart to determine the best time to publish blog posts and maximize engagement.
2. High-activity Vs Low-activity Hours - Understand the pros and cons of posting during high-activity hours for more engagement and comments, or low-activity hours for increased visibility.
3. Morning Reading and Monday Traffic - Take advantage of the fact that users tend to read blog posts in the morning and capitalize on the highest traffic on Mondays.
Industry Implications
1. Blogging and Content Creation - Bloggers and companies utilizing blog platforms can optimize their content strategy and timing for better engagement.
2. Social Media and Digital Marketing - Digital marketers can use the insights from the 'KISSmetrics' Chart to enhance their social media posting schedules and maximize reach.
3. Analytics and Data Analysis - Professionals in analytics and data analysis can leverage the data provided by the infographic to optimize content performance and measure the impact of timing on engagement.
2
Score
Popularity
Activity
Freshness


