The Broadway Infographic Reveals the Numbers Behind-the-Scenes
Kevin Young — May 20, 2012 — Pop Culture
References: bestshowticketslasvegas & infographicsshowcase
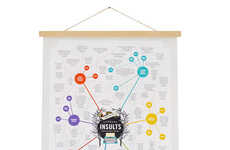
This Broadway infographic is as theatrical as the musicals it represents, and is created by Best Show Tickets, a Las Vegas ticket distribution firm that reveals behind-the-scenes information.
You either love them or you hate them, but musicals have a way in the entertainment industry that lures people in. From Cirque du Soleil to Wicked to Mamma Mia, this Broadway infographic illustrates the costs and types of productions that musicals endure.
It's fascinating to see the 'Ka' show, among other Cirque du Soleil performances, make more money than what's invested into the production cost, as its performances always succeed in profits. This infographic breaks down the musical industry to show viewers a wide range of information about actors' wages to the carbon emission that's produced.
Trend Themes
1. Digital Infographics - Disruptive innovation opportunity: Develop interactive digital infographics that provide behind-the-scenes information about different industries.
2. Cost Analysis - Disruptive innovation opportunity: Create cost analysis tools for businesses in the entertainment industry to optimize production budgets and increase profits.
3. Sustainability in Entertainment - Disruptive innovation opportunity: Implement sustainable practices in the entertainment industry to reduce carbon emissions and promote environmental responsibility.
Industry Implications
1. Ticket Distribution - Disruptive innovation opportunity: Utilize advanced technology and data analytics to revolutionize the way tickets are distributed for live performances and events.
2. Theatrical Production - Disruptive innovation opportunity: Integrate virtual reality and immersive technologies into theatrical productions to enhance audience engagement and create new storytelling experiences.
3. Entertainment Analytics - Disruptive innovation opportunity: Develop advanced analytics platforms to help entertainment businesses analyze data and make data-driven decisions for marketing, production, and distribution strategies.
0.6
Score
Popularity
Activity
Freshness


