Where do You Fall on the 'Startup Ecosystem: Predator vs. Prey' Infograph?
Jennifer Gosnell — June 4, 2012 — Eco
References: coolinfographics & columnfivemedia
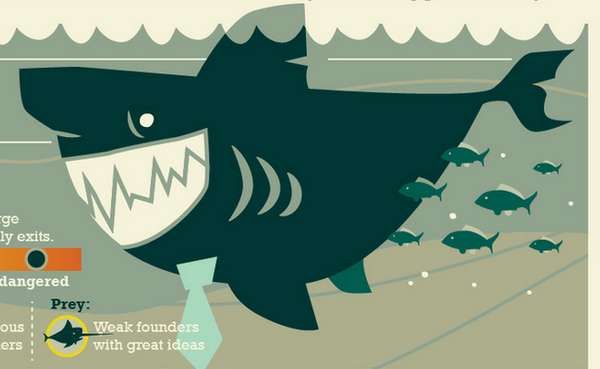
The 'Startup Ecosystem: Predator vs. Prey' infograph takes a look at how ventures fare in today's world. To properly assess what your strengths and weaknesses are, you must first take a good look and decide where you fall. Using sea creatures to display how the food system of startup projects is like, the infograph is a fantastically whimsical display of one of the most important capitalist ventures.
Not only does the graph create profiles of what role you and your company, idea or firm plays in the ecosystem of venture projects, but it then goes on to point out areas of "prey," or "predator" and ranks you on a scale of ubiquitous to endangered. While the graph incorporates a lot of humor and lighthearted sea jokes, it actually does provide some interesting insights into the world of startup businesses.
Not only does the graph create profiles of what role you and your company, idea or firm plays in the ecosystem of venture projects, but it then goes on to point out areas of "prey," or "predator" and ranks you on a scale of ubiquitous to endangered. While the graph incorporates a lot of humor and lighthearted sea jokes, it actually does provide some interesting insights into the world of startup businesses.
Trend Themes
1. Startup Ecosystem - Analyzing the food system of startup projects and identifying strengths and weaknesses can help companies strategize their role in the ecosystem.
2. Predator-prey Dynamics - Utilizing humor and lighthearted sea jokes, the Predator vs. Prey infograph provides insights into the predator-prey dynamics in the startup world.
3. Risk Assessment - The infograph ranks companies on a scale of ubiquitous to endangered, helping them assess their level of risk in the startup ecosystem and strategize accordingly.
Industry Implications
1. Startup Incubation - Startup incubators can use this infograph to analyze the risk levels of ventures and provide strategic guidance for success.
2. Venture Capital - Venture capital firms can utilize the Predator vs. Prey infograph to assess the viability and potential returns of investment opportunities in the startup ecosystem.
3. Entrepreneurship Education - Entrepreneurship education programs can incorporate this infograph into their curriculum to teach aspiring entrepreneurs about the risks and dynamics of the startup ecosystem.
3.8
Score
Popularity
Activity
Freshness


