This Keyboard Frequency Sculpture is a 3D Bar Graph
Amelia Roblin — June 2, 2011 — Tech
References: itp.nyu.edu & neatorama
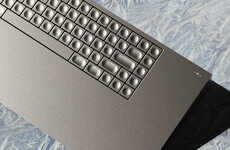
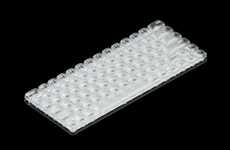
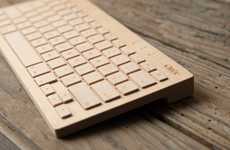
You may wonder what the use is of a typer with extruded keys, but the Keyboard Frequency Sculpture is a diagram of usage, rather than a functional object itself.
Creator Mike Knuepfel is interested in 3D infographics, and in this clever project, he wished to demonstrate the utilization of different letters on his computer keyboard. Using a graph he acquired from Wikipedia, the designer set out to model a set of towers with varying heights, corresponding to the incidence of usage of each alphabetic key.
The result is an interesting study on the English language as well, in mapping out the popularity of specific characters. Despite the inclusion of data from keyboard shortcuts and online lingo, the Keyboard Frequency Sculpture is a great representation of contemporary vocabulary.
Trend Themes
1. 3D Keyboard Sculptures - The trend of creating 3D sculptures depicting keyboard usage could lead to new forms of data visualization in various industries.
2. Infographic-inspired Design - The trend of incorporating infographic elements into design projects could inspire new ways of presenting data for businesses in various industries.
3. Usage-based Data Analysis - The trend of analyzing usage data could lead to insights and innovations in industries such as marketing, product design, and technology development.
Industry Implications
1. Data Visualization - The use of 3D sculptures and infographic elements in data visualization could disrupt the industry and allow for more engaging and interactive displays of information.
2. Design - The integration of infographic-inspired design elements could disrupt the design industry, leading to new ways of presenting information in a visually appealing and informative way.
3. Technology - Usage-based data analysis could disrupt the technology industry, leading to the development of products that better reflect user habits and preferences.
2.9
Score
Popularity
Activity
Freshness

