Felix Pharand-Deschenes Illustrates Global Interactions
Meghan Young — November 4, 2011 — Tech
References: globaia.org & mymodernmet
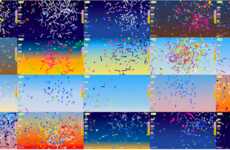
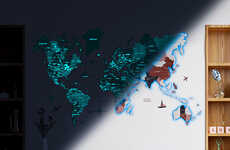
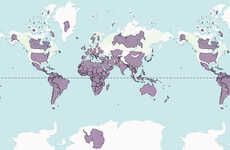
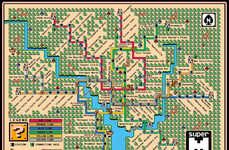
With the mind-boggling news that the world population is now exceeding 7 billion, infographics illustrating this and more are bound to start popping up all over the Internet; yet Felix Pharand-Deschenes illustrations are all that is needed. Mapping out human activity around the globe, this Canadian scientist shows the population just how it's living on this planet called Earth.
From roadways and airway traffic to Internet cables and electricity transmission lines, Felix Pharand-Deschenes creates paths that mark human activity. Using factual information obtained from various US government agencies, his Mapping series may be steeped in science, but he could very well forego his day job and become an artist. Felix Pharand-Deschenes are not just informative, but beautiful as well.
From roadways and airway traffic to Internet cables and electricity transmission lines, Felix Pharand-Deschenes creates paths that mark human activity. Using factual information obtained from various US government agencies, his Mapping series may be steeped in science, but he could very well forego his day job and become an artist. Felix Pharand-Deschenes are not just informative, but beautiful as well.
Trend Themes
1. Global Mapping - Opportunity for creating interactive global maps that showcase human activity across different regions.
2. Infographics - Opportunity for designing visually appealing infographics that communicate complex information in a simple and engaging manner.
3. Data Visualization - Opportunity for developing innovative ways to represent data through visual storytelling, capturing the attention and interest of the audience.
Industry Implications
1. Geospatial Technology - Disruptive innovation opportunity to develop advanced mapping and geospatial technologies that provide real-time data on human activity.
2. Design and Advertising - Disruptive innovation opportunity to use visual design techniques to create compelling and informative infographics for various industries.
3. Data Analytics - Disruptive innovation opportunity to develop advanced data visualization tools and techniques that transform complex data into meaningful insights.
5.6
Score
Popularity
Activity
Freshness


